
Why H1 Attrition Data Is Already Stale
The H1 attrition report on a CFO's desk in July describes decisions employees made the prior fall. The decisions producing the next wave of departures are happening now — and the data describing them is more than a year away.
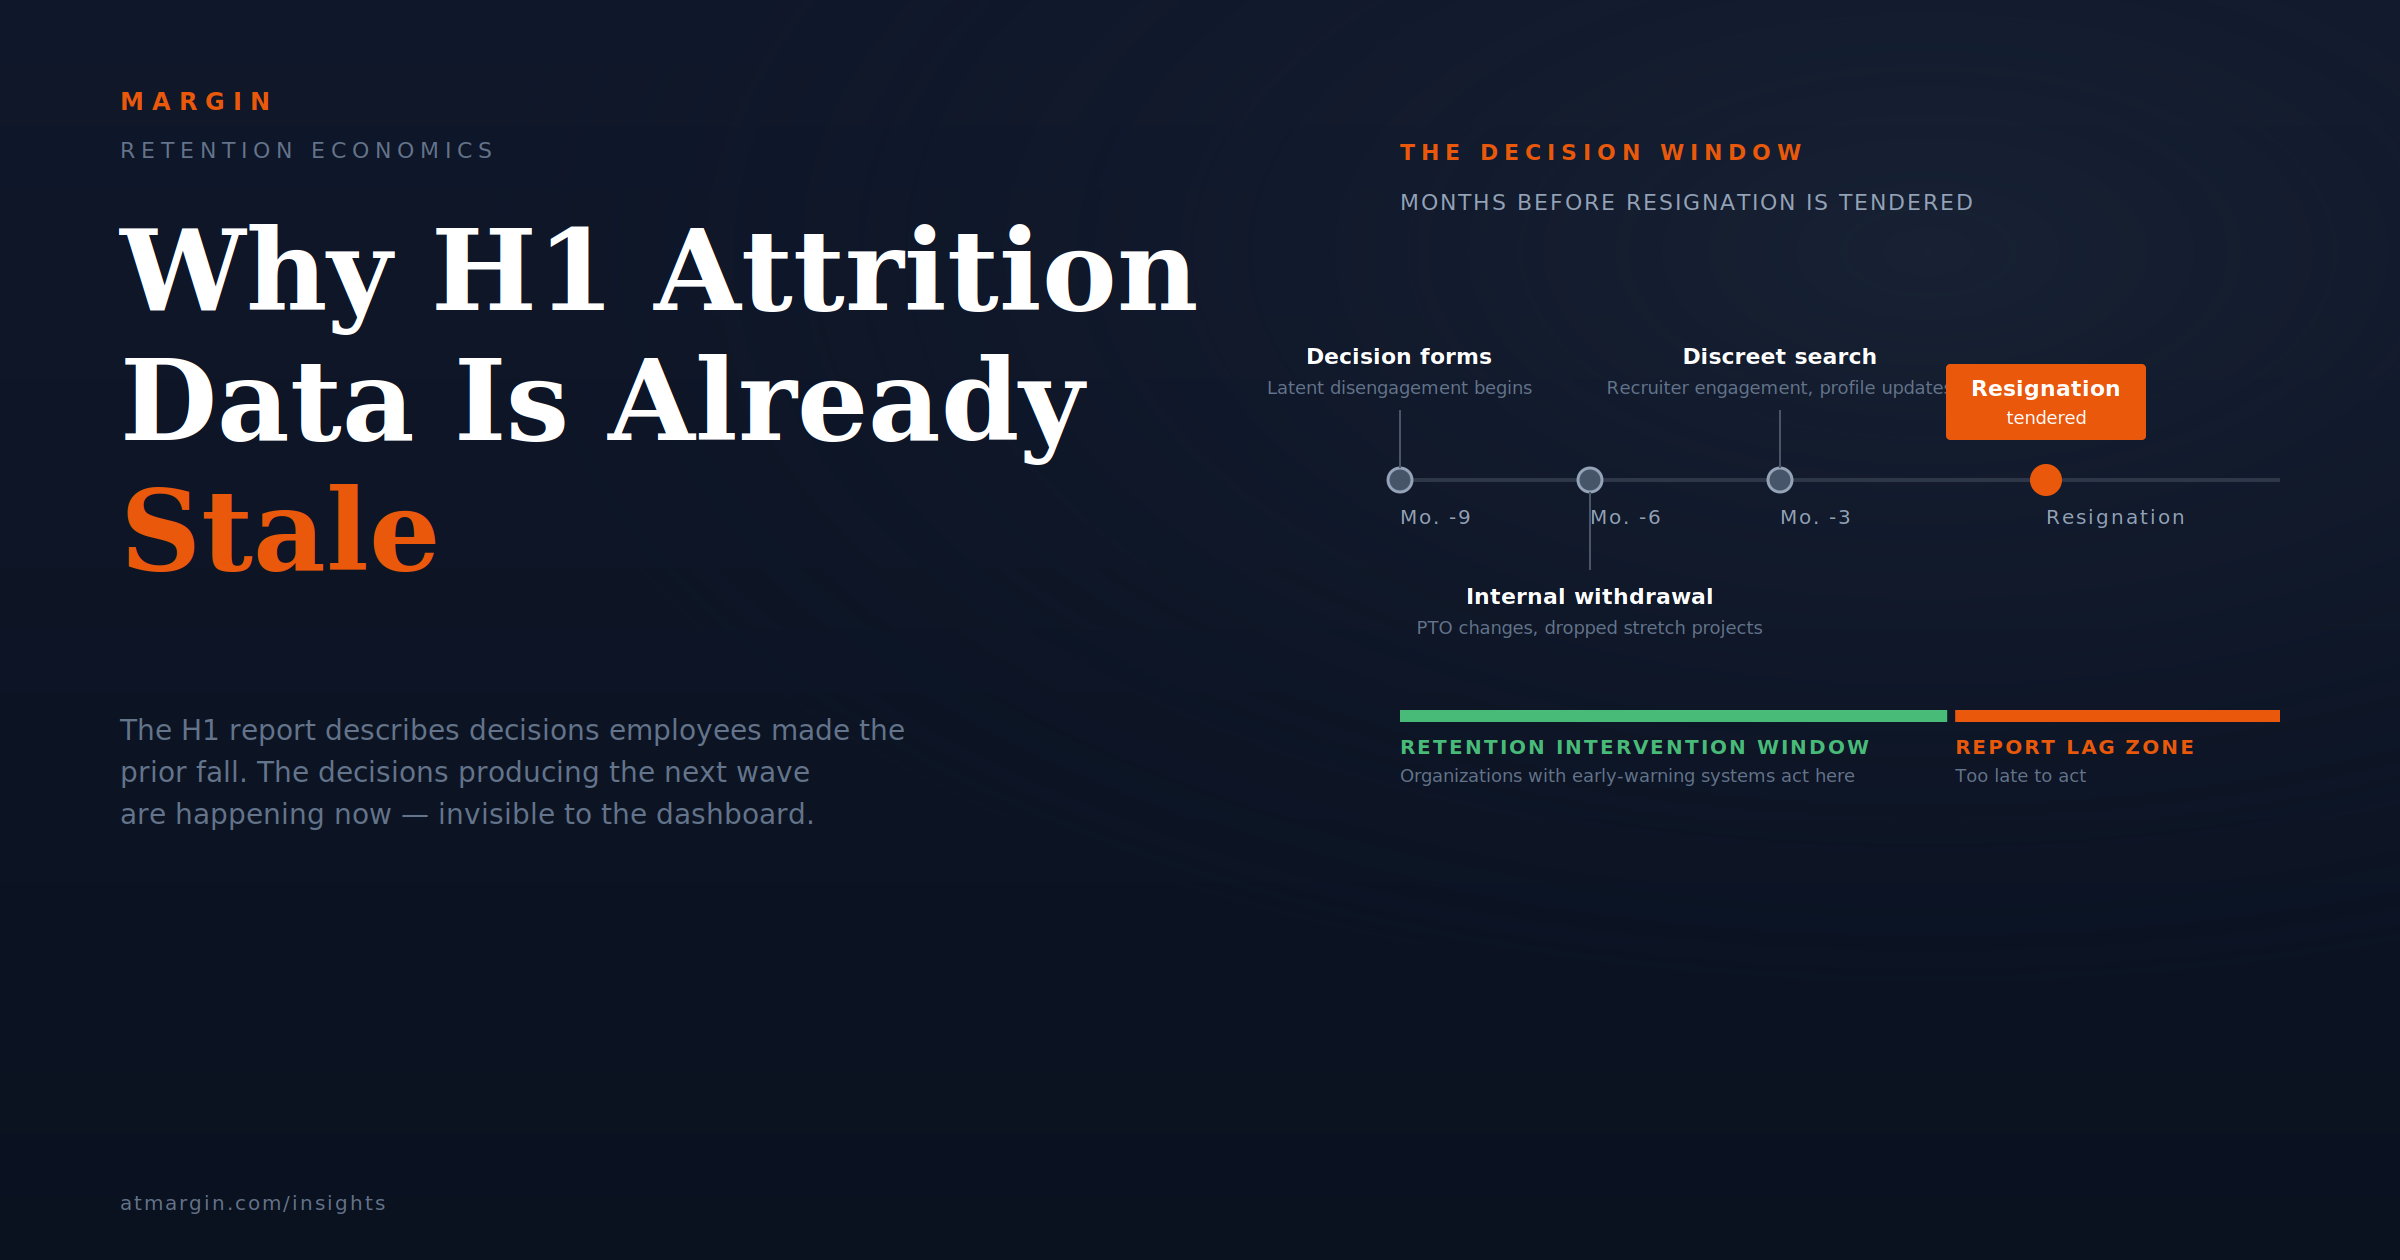
A CFO at a multi-site distributor reviews the H1 attrition report in mid-July. Voluntary turnover is 14 percent annualized, up from 11 percent the prior year. The CFO calls a meeting with the CHRO. They discuss interventions — comp adjustments, manager training, an engagement survey refresh, a stay-interview pilot. By the time the interventions are designed, budgeted, and approved, it is October. They roll out across the organization in November.
The next wave of resignations begins hitting in December. The H1 attrition report did not see them coming, because the people resigning in December decided to leave the prior winter. The interventions deployed in November will not affect them. They will affect the people now deciding to leave next March — if those people are still around to be affected, and if the interventions happen to address the actual reasons they are deciding to leave.
This is the structural problem with H1 attrition data, and it does not get solved by improving the report. The data is constitutionally incapable of describing the present. By the time a departure shows up in the dashboard, the decision that produced it was made nine months earlier.
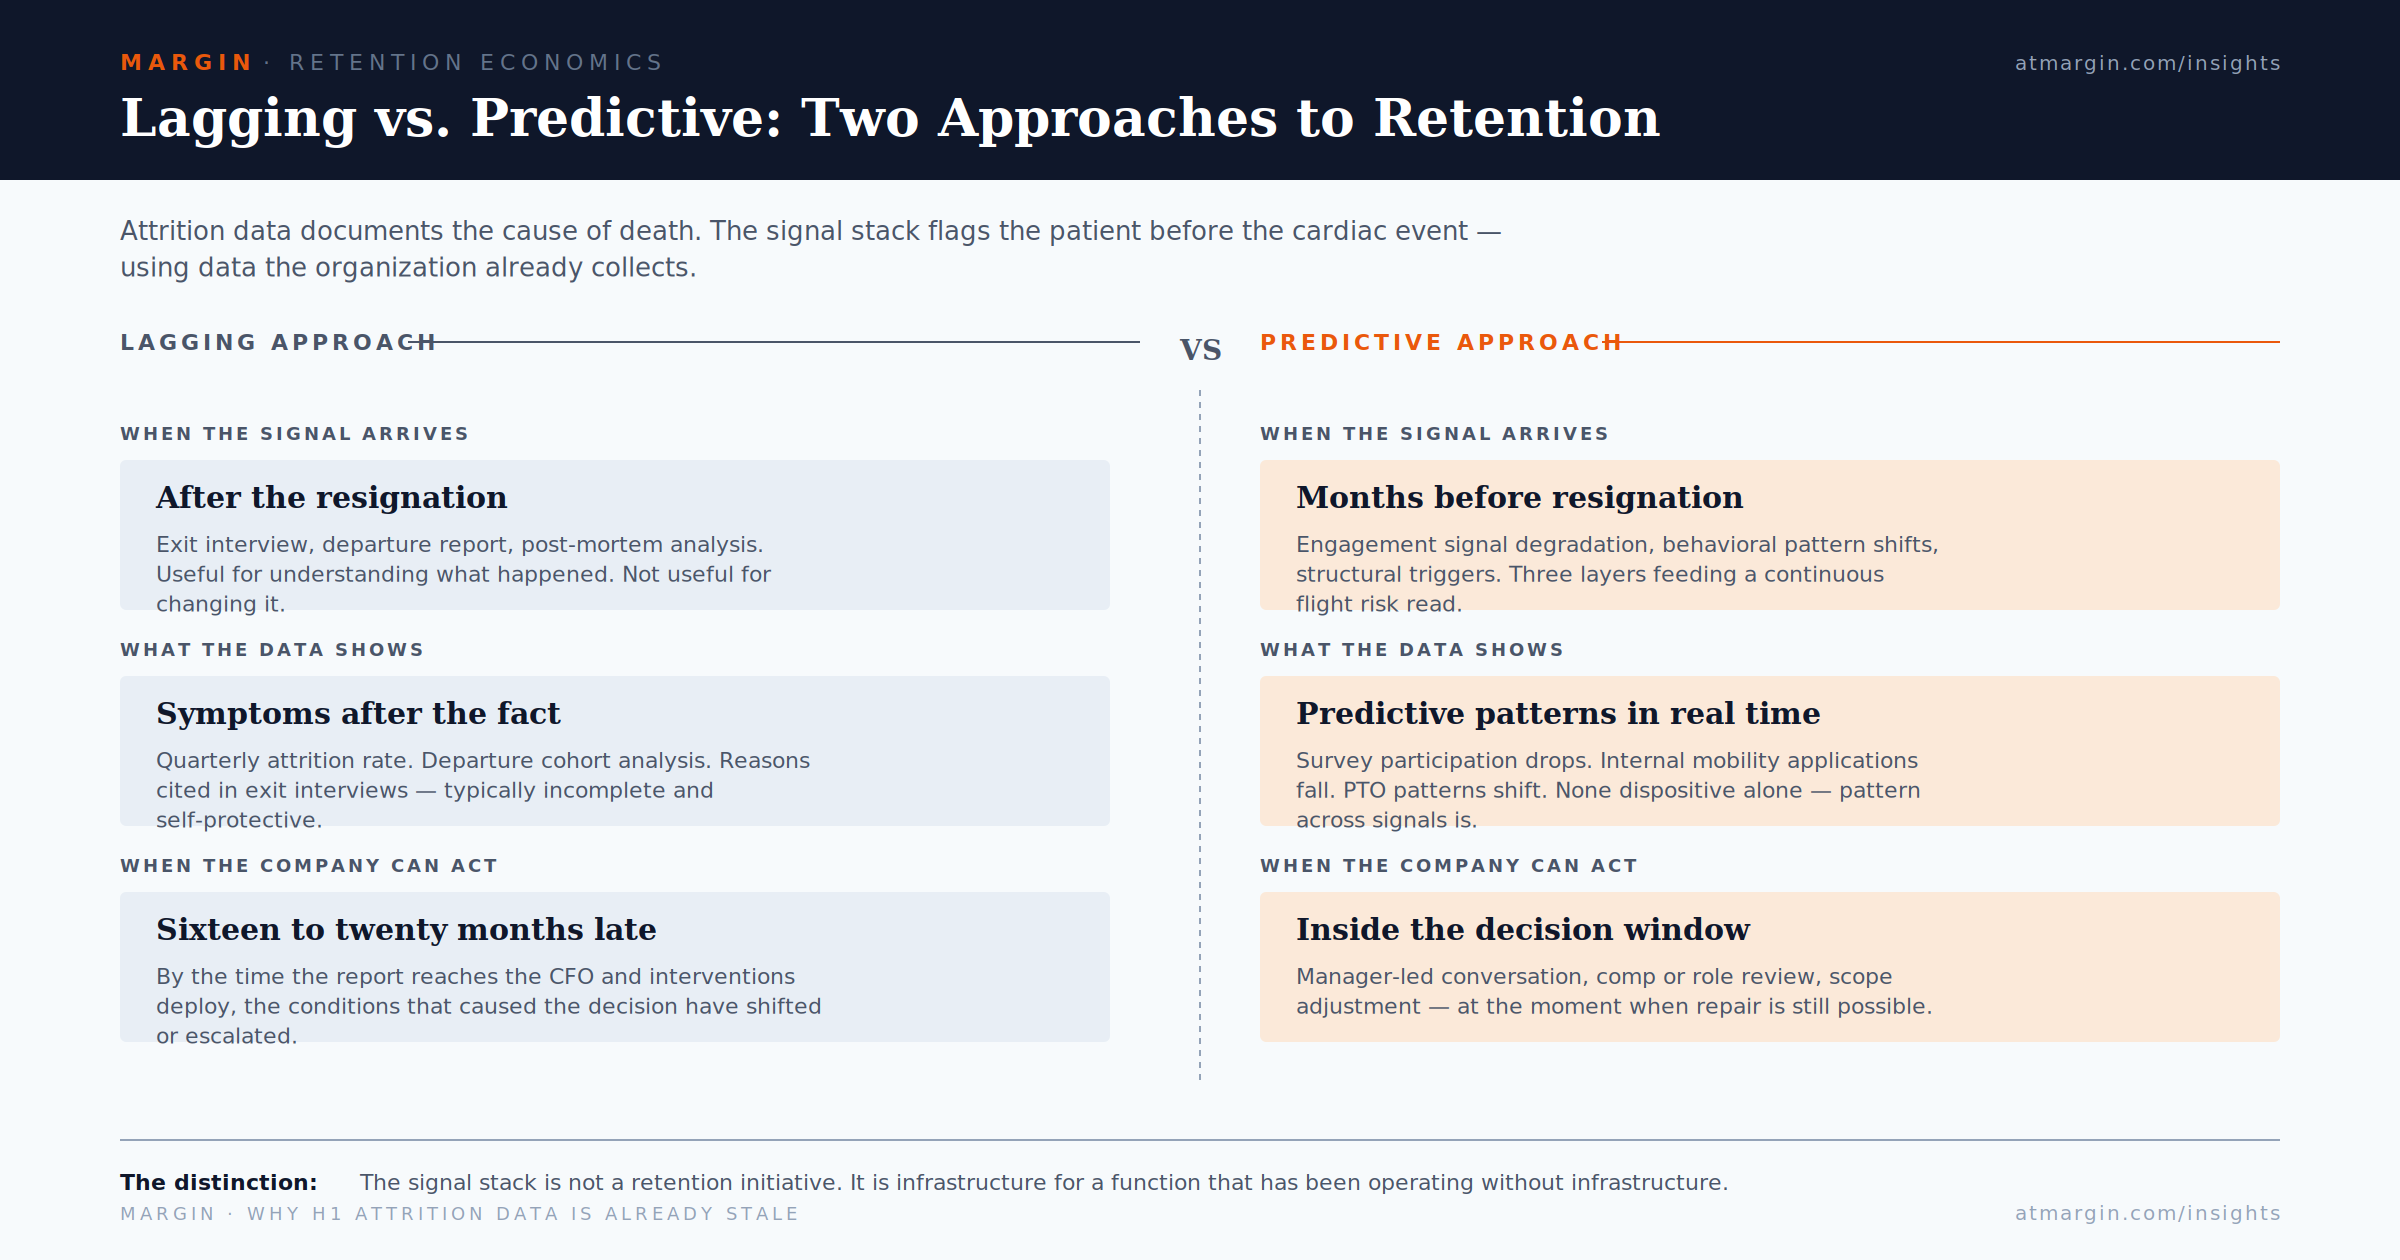
The dashboard's lag is not a refresh problem. It is a category problem: attrition reporting measures the ending of a process whose decisions were made at the beginning, and the beginning is months or quarters in the past. Attrition data is autopsy data. It documents the cause of death. The organizations winning on retention have stopped funding bigger autopsies and started funding the diagnostics that flag the patient before the cardiac event.
The Lag Baked Into the Data
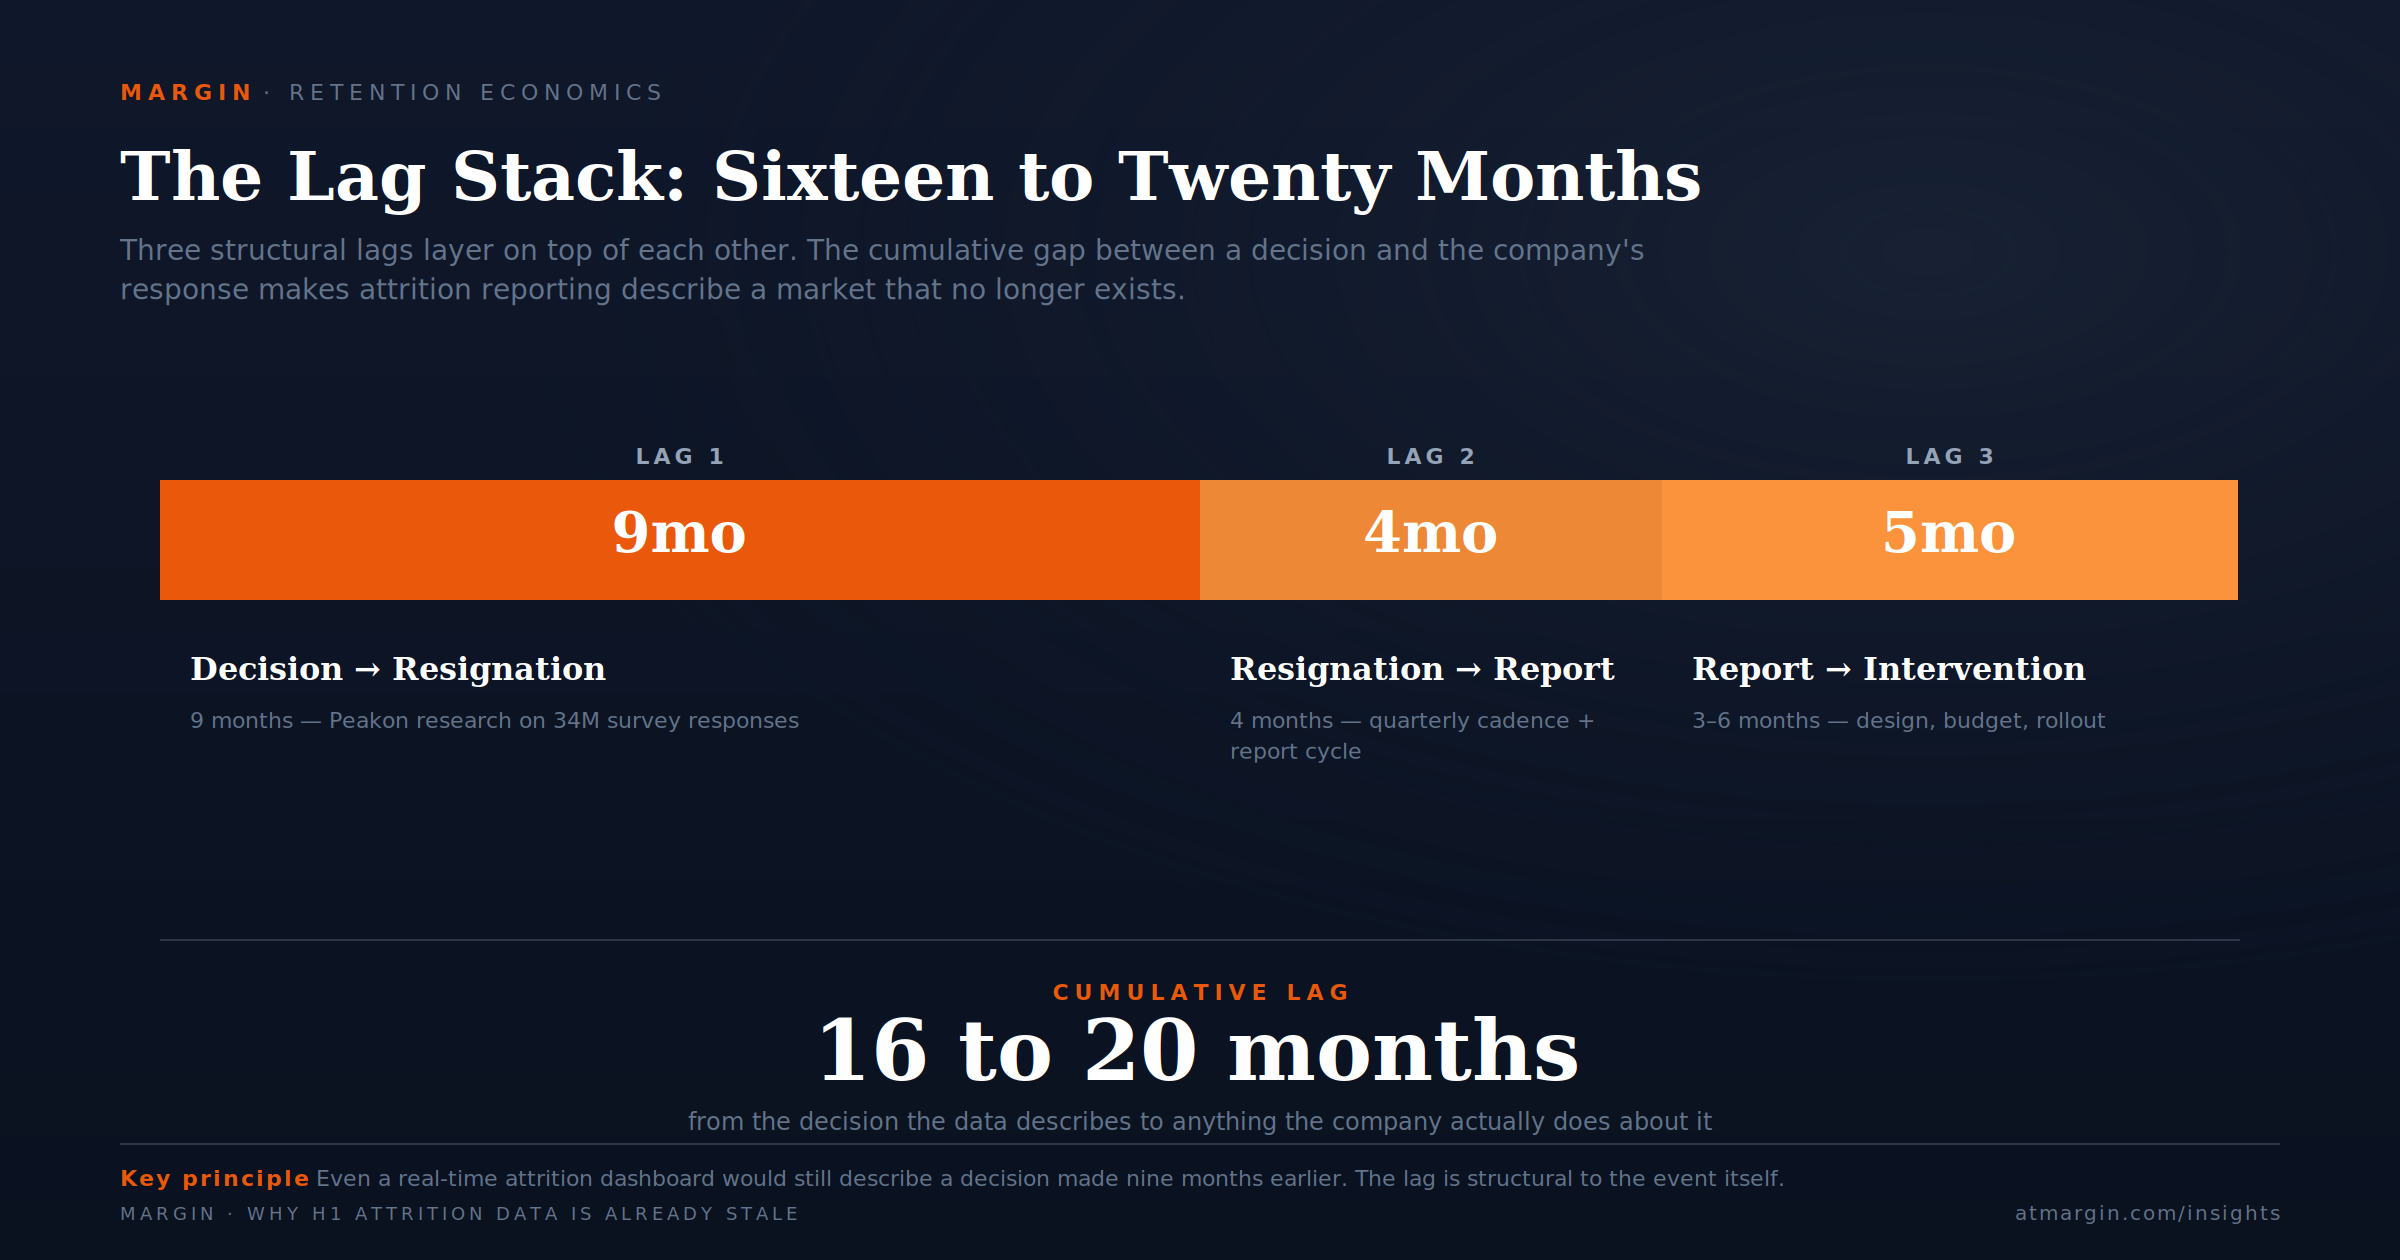
Three structural lags are baked into any H1 attrition report, and together they make the report a description of events that are sixteen to twenty months stale by the time anyone acts on it.
Deciding to Leave vs Actually Leaving
The first lag is the gap between deciding to leave and actually leaving. Workplace analytics firm Peakon, drawing on more than 34 million employee survey responses across 36,000 departing workers, found that employees begin showing measurable signs of disengagement an average of nine months before submitting a resignation. The departure date is the visible event. The decision date precedes it by roughly three quarters. By the time HR records a March resignation, the decision underlying it was made the previous June.
Resignation vs Reporting
The second lag is the gap between resignation and reporting. Most companies produce attrition reports on a quarterly or half-yearly cadence. A March resignation enters the H1 dashboard, which is published in July at earliest, and reaches the CFO's desk shortly after. That is four months between resignation and report — an additional lag layered on top of the first.
Report vs Intervention
The third lag is the gap between report and intervention. By the time the CFO reads the July report, calls the CHRO, designs interventions, secures budget, and rolls them out, three to six months have passed. The interventions land in October or November. They are addressing the conditions that prompted decisions made the previous winter — but the conditions have shifted, the people most affected are gone, and the people still around are six months further along in their own decision processes.
Stack the three lags. A resignation showing up in the H1 attrition report represents a decision made roughly nine months earlier. The report itself takes another four months to surface. Interventions designed in response take another three to six. By the time anything actually changes inside the organization, sixteen to twenty months have passed since the decision the data is describing. The market the data describes no longer exists. The conditions that produced those resignations have either resolved, escalated, or been replaced by new conditions the data has not yet detected.
This is what makes attrition reporting a category mistake, not just a stale one. A category mistake cannot be fixed by running the report more often. Even a real-time attrition dashboard — one that updated the moment a resignation letter was filed — would still be describing a decision that was made nine months earlier. The lag is not in the reporting infrastructure. It is in the structure of a resignation event itself: by the time it is observable, it has already happened.
Call the cumulative cost of operating on lagging attrition data the lag premium. Most finance teams pay it without ever putting it on a line item. The premium is paid in retention interventions deployed against last year's problem, in compensation adjustments awarded to people who already mentally departed, in manager training programs that arrive after the manager's strongest performers have signed elsewhere, and in the cost of replacing employees the organization could have retained if it had seen them disengaging six months earlier.
SHRM puts the replacement cost of a lost employee at 50 to 200 percent of annual salary depending on role; the lag premium captures the share of that cost the organization pays because it was looking at the wrong dashboard.
The Decision Window
Inside the nine-month gap between decision and departure is a structured sequence of changes that most organizations have the data to detect and almost none of them are looking at. Call it the decision window: the period between when an employee makes the internal decision to leave and when they file the resignation letter that makes it official.
“From the perspective of the manager, the departure feels sudden — but to the data the company already has, it was visible for the better part of a year.”
Window Opening
The window opens with what researchers call latent disengagement. The employee is still showing up, still hitting their numbers, but something has shifted. They have stopped advocating for the role internally. They are no longer pitching new ideas in their team meetings. They are not asking for the next development opportunity. From the outside, performance looks intact. From the inside, the employee has stopped investing in the future of the relationship.
60 to 90 Days
Sixty to ninety days later, the discreet job search typically begins. LinkedIn profile updates increase. The employee starts taking calls during lunch. They begin declining the stretch projects that would commit them to long-running deliverables. Their participation in voluntary internal activities — interview panels, hiring committees, town hall questions — drops measurably. They are no longer using the organization to grow; they are using it to maintain a stable runway while they look elsewhere.
Month 4
By month four or five, the employee has typically engaged at least one external recruiter and is pursuing active opportunities. Their internal mobility application drops to zero. Their PTO usage pattern often changes — either decreasing as they hoard time for transition, or increasing as they take days off for interviews. Their calendar begins reflecting fewer cross-functional meetings; they are conserving political capital they no longer plan to spend.
Month 7
By month seven or eight, an offer is in hand or close. The employee renegotiates nothing internally because they no longer expect to stay. They accept role changes, manager changes, and comp inequities they would have pushed back on a year earlier — not because the changes don't matter, but because the changes are no longer their problem.
Month 9
The resignation letter arrives in month nine. From the perspective of the manager, the departure feels sudden. From the perspective of the data the company already has, it was visible for the better part of a year.
A VP of Human Resources at a regional healthcare system described the realization this way:
"We had a 40-bed hospital in our network with 18 percent annualized turnover among RNs in 2024. The board pushed us to figure out what was driving it. We pulled the engagement data going back two years. The signals were all there — declining survey participation, drops in internal job posting applications, PTO consumption patterns shifting — but they were sitting in three different systems and nobody was looking at them as a single picture. By the time the resignations came, we were six months too late on every one. We were not failing at retention. We were failing at observation."
The cost of a non-observed decision window is structural.
Retention interventions deployed inside the window — a comp adjustment in month two, a role redesign in month four, a stretch assignment in month five — have a fighting chance of reversing the decision.
Interventions deployed after month seven, when an external offer is being weighed, almost never do; counter-offers have a poor track record because the comp adjustment does not address whatever produced the disengagement in the first place.
The window opens early and closes late. Most companies show up after the window has closed, and then mistake the closure for an unsolvable retention problem rather than a missed observation.
The Signal Stack
The corrective is to build a measurement architecture that observes the decision window in real time and flags the conditions that precede a resignation by months rather than days. Call this the signal stack: a layered set of leading indicators, drawn from data the organization already collects, that together produce a flight risk picture before the resignation letter is filed.
The stack has three layers, each running on its own cadence and feeding into a unified read of risk.
Engagement Signal Degradation
The first layer is engagement signal degradation. Most organizations run engagement or pulse surveys; few of them watch the survey signals at the level of granularity that makes them useful.
The relevant signals are not the headline scores. They are the deltas: a high-performing employee whose response score drops fifteen points in two consecutive pulses, a team whose participation rate falls below the company average, a manager whose direct reports stop responding to surveys altogether.
Researchers have noted that disengaged employees disengage from surveys first; the survey response rate itself becomes a leading indicator before any of the survey content does. A team that has stopped responding is not satisfied. It is checked out.
Behavioral Pattern Shifts
The second layer is behavioral pattern shifts. These run on internal data the organization already has, mostly without realizing it: internal mobility applications, PTO consumption patterns, calendar density, participation in voluntary internal activities, frequency and length of one-on-one meetings, time on cross-functional projects.
None of these signals is dispositive on its own. A given employee might decline a stretch project because they are managing a parental leave logistic, not because they are interviewing elsewhere. But the pattern across signals — declining one-on-ones, plus dropped internal mobility applications, plus reduced cross-functional engagement — produces a confidence signal that no single data point provides.
The same logic banks use for fraud detection: no single transaction is suspicious; the pattern across transactions is.
Structural Triggers
The third layer is structural and external triggers. These are conditions external to the individual that increase flight risk across a population: a manager change, an organizational restructuring, a competitor opening a new facility nearby, a market-rate compensation gap that has widened beyond the company's pay band.
Structural triggers do not predict individual resignations. They predict elevated risk across the affected population, and they tell the organization where to focus the individual-level signals.
Together, the three layers produce a flight risk read that updates continuously rather than annually. A flagged employee gets an intervention window — typically a manager-led conversation, sometimes a comp or role review — before the decision window closes. The intervention is not a counter-offer to a resignation that has already been delivered. It is an investment in a relationship that is showing repairable strain, made at the moment when repair is still possible.
The financial logic is straightforward. SHRM's range of 50 to 200 percent of annual salary as the cost of replacing an employee implies that an intervention saving even one mid-level departure pays for substantial monitoring infrastructure.
Companies that have implemented predictive attrition analytics report turnover reductions of up to 20 percent compared to baseline. Even a fraction of that improvement, in an organization with three or four hundred annual departures, returns several million dollars a year against a measurement system that costs a small share of one of those replacements.
What Predictive Retention Requires
Adopting the signal stack requires four organizational changes that most companies have not yet made.
Data Integration
The first change is data integration. The signal stack does not work when engagement data sits in one platform, mobility data in another, PTO data in a third, and performance data in a fourth. The unified flight risk picture requires a data architecture that joins them — typically a workforce analytics layer that pulls from each source on a defined cadence and produces a single risk read per team or role family.
The CFO has to fund this. The CHRO has to own it. Without the integration, the signals exist but the picture does not.
Manager Capability
The second change is manager-level capability. The signal stack produces flags. The flags are useless without managers who know how to act on them. A flagged employee requires a calibrated conversation, not a generic one — typically a one-on-one in which the manager surfaces what they have observed (without naming the dashboard) and asks what is shifting for the employee.
Most managers have never had this kind of conversation, and most are uncomfortable having it. The capability has to be built through training, scripted prompts, and HR partnership during the first dozen flagged conversations a manager runs. Without it, flags get raised and ignored, and the system loses credibility with the people whose intervention determines whether it works.
Intervention Authority
The third change is intervention authority. A flagged employee may need a comp adjustment, a role redesign, a manager change, or a stretch project that the manager does not have the unilateral authority to approve. The system breaks if every intervention requires four levels of approval and a six-week budget cycle.
Predictive retention requires that managers have a defined intervention budget and a ladder of pre-authorized actions they can take inside the decision window, with audit visibility but not pre-approval gating. This is uncomfortable for finance leaders accustomed to controlling every comp adjustment. The discomfort is the price of acting at the speed the data permits.
Ethical Guardrails
The fourth change is ethical guardrails. Flight risk modeling is, in its raw form, individual-level surveillance. An organization deploying it carelessly — using individual flight risk scores to make termination decisions, denying promotions to flagged employees, or surfacing the dashboard to managers without context — will damage trust faster than it reduces attrition.
The defensible deployments are anonymized, aggregated, and used to flag conditions rather than people: a team carries elevated risk; a role family is showing signal degradation; a manager's direct reports are disengaging at twice the company rate. The system tells the organization where to look. It does not pre-judge the people it surfaces. Companies that ignore this distinction discover that surveillance accelerates the exits the system was designed to prevent.
These four changes — data integration, manager capability, intervention authority, ethical guardrails — are not retention initiatives. They are infrastructure for a function that has been operating without infrastructure. The organizations building them are not running better engagement programs than their peers. They are running a different function entirely: retention as a continuous diagnostic, not retention as an annual review.
The Difference
The companies looking at H1 attrition data in July and feeling informed are funding a function that describes events sixteen months in the past. The companies that have built the signal stack are watching the next year of attrition decisions form in real time — and intervening while the windows are still open.